Creating simple, customizable visualizations, entirely with free web tools
I read about the world's most popular YouTube channels. I found the list of the top 50 channels on Wikipedia. The channels were listed with the number of subscribers, language, and category. I was quite surprised by the languages and content categories listed and felt that this was something great to share via a simple bar chart visualization.
I have been interested in getting better with building visualizations and have sampled a variety of tools already, but never really gained practice with them. I had a look at a few tools but wasn't impressed. As a developer, I look for customizations. Finally, I settled for QuickChart, which provides an API to make charts via a simple JSON-based declarative syntax. Check out the Chart Maker tool.
Ghost Theme Data Referencing Syntax
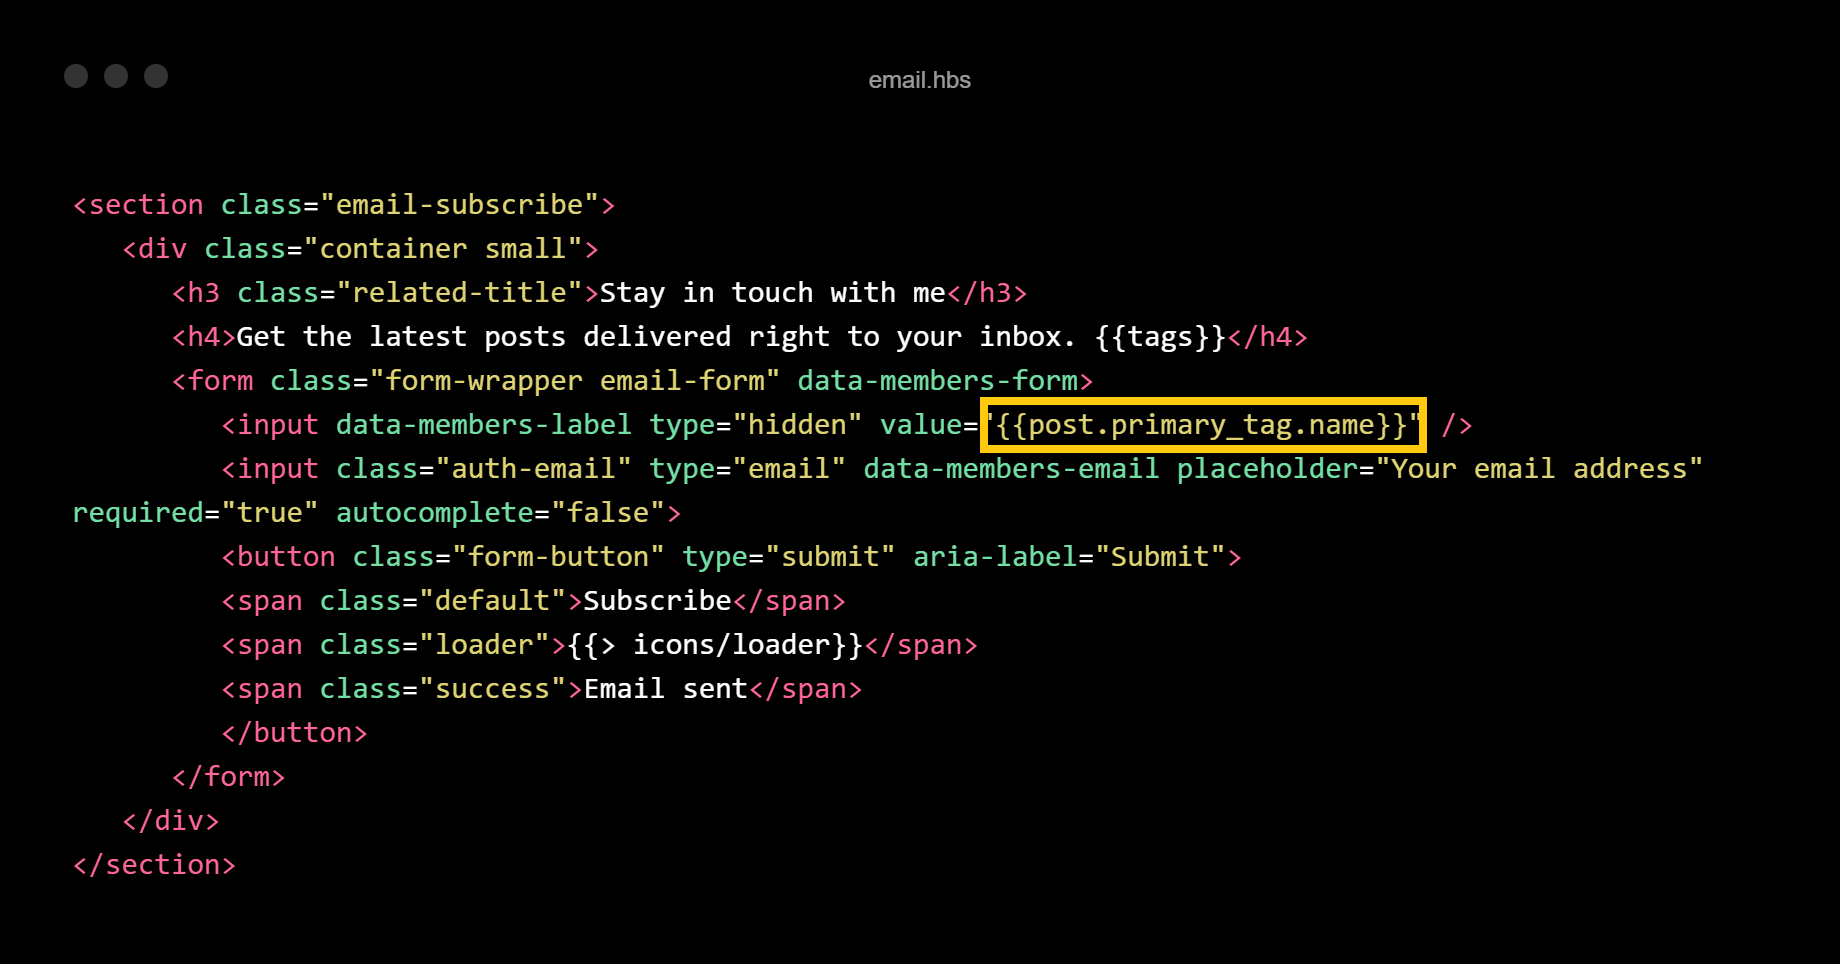
In order to maximize the value that readers of my website get, I wanted a way to segment the subscribers to my email list by the type of content they were reading when they subscribed. Thankfully, the documentation specifies a clear way to do that within the sign-up form.
The next challenge was to get the relevant tag value and make it the value of the label. In the process, I discovered that Ghost theme helpers are just Javascript objects that can be referenced from within partials. This is neat!